
From Sensor to Dashboard: How IoT Data Gets There
Follow data through an IoT system, from a sensor and device to the network, cloud, dashboard, and automated action.
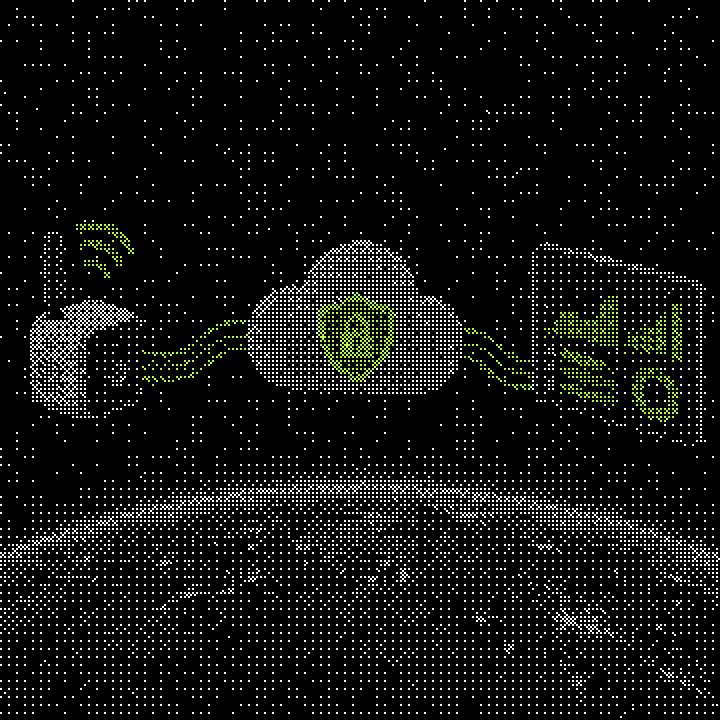
A temperature sensor records a value of 25. How does that value become a chart on a dashboard? And if the temperature rises, what sends an alert or prompts another device to respond? The answer is the path data takes through an IoT system.
Connecting a device to the internet does not make it useful on its own. Data has to be measured, sent from the device, delivered to software, and presented in a form people can use. Sometimes that path ends with an automated action.
For an introduction to the idea and applications of IoT, see our IoT guide. Here, we follow data from the sensor to a dashboard.
1. A sensor measures a change
The process starts with something physical: the air temperature changes, soil dries out, or a machine vibrates more than usual. A sensor measures the change and turns it into a value a device can read.
A greenhouse might track temperature, humidity, and light. A factory sensor might measure vibration, pressure, or energy use. These readings are raw data; software needs to receive and manage them before anyone can use them.
2. A controller prepares the data
A board or controller reads the sensor and prepares its value for the next step. It can record when the reading was taken, check it against a simple condition, or determine how often to send it.
Many IoT prototypes use a board such as the ESP32. For example, a controller can read an electricity meter and send the value with its timestamp to a central system.
3. A network carries the message
Data needs a communication path to reach software. Depending on the installation and project, that path might use Wi-Fi, Ethernet, a mobile network, LoRa, or another technology.
As the number of devices grows, sending messages is only part of the job. The system needs to identify each device and manage its connection. The design should also define what each device sends and where it receives commands.
4. The cloud receives and stores data
Once data reaches cloud infrastructure, it can be recorded, compared with earlier readings, and made available to other parts of the system. A greenhouse operator can check the current temperature, for example, and review its history to understand how it changed over the past few days.
At this layer, software manages devices and their data, then makes that information available for display or processing. This work becomes more important as device counts and data volumes increase.
5. A dashboard makes data easier to read
People usually do not need to inspect raw device messages one by one. A dashboard can show current status, chart changes over time, and make alerts easy to find.
For a factory manager, knowing which machine needs attention is more useful than reading every sensor message. A dashboard presents technical data in a form people can understand and act on.
6. Automation can start an action
Some systems do more than display data. A team can define a condition that sends an alert or starts another action when a value crosses a threshold.
If a cold room gets too warm, the system can send an alert. In a greenhouse, low soil moisture could trigger irrigation. In each case, the sensor supplies data and software checks the condition.
From prototype to product
A board, a sensor, and a few lines of code may be enough to capture the first reading. As the device count grows, teams also need to manage device identity, data history, user access, dashboards, automation, and firmware updates with the Flova SDK.
An IoT product is more than hardware or a network connection. Devices, software, and data have to work together, and teams need a plan for each layer and the connections between them.
Where Flova fits
The Flova IoT platform provides tools for managing the software side of this path. Devices produce data, while the platform helps teams define and manage it, view devices, and build a product experience. Teams can focus on their product and device behavior instead of building every part of this infrastructure from scratch.
For API details, see the Flova API documentation.
A simplified path looks like this: device, network, Flova platform, data, and dashboard. Projects differ, but understanding the path helps teams see where data is produced and processed, and how it can lead to a decision or action.